
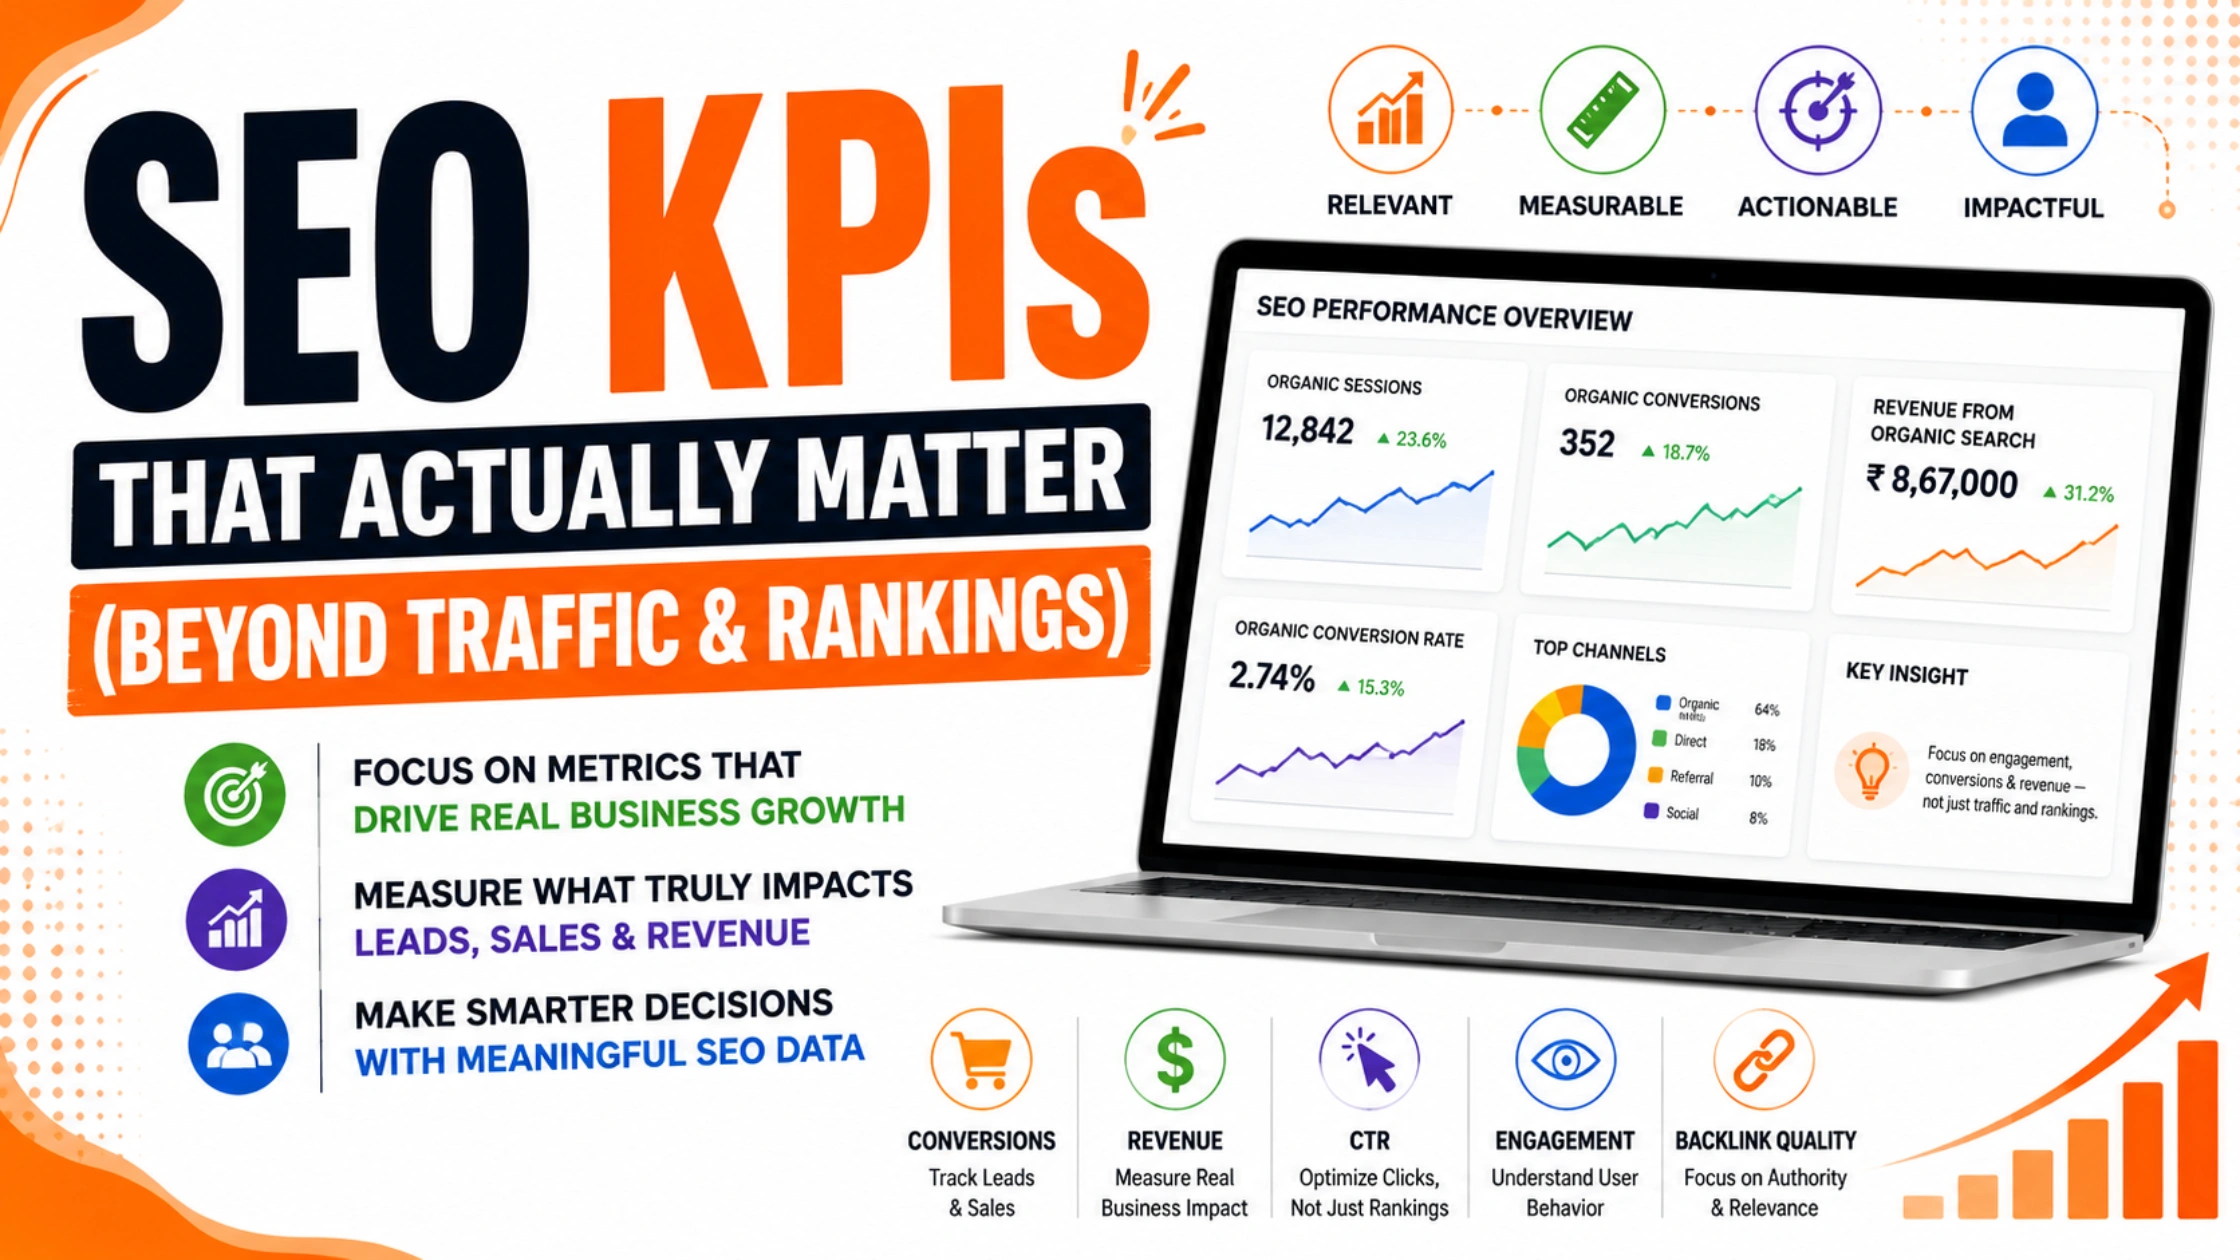
SEO KPIs That Actually Matter (Beyond Traffic and Rankings)
What Are SEO KPIs?
Have you ever looked at your Google Analytics dashboard, seen your traffic go up 30%, and still had no idea whether your SEO is actually working?
You are not alone. That feeling is exactly what happens when you track SEO metrics without connecting them to business goals.
SEO KPIs (Key Performance Indicators) are the specific, measurable values you track to evaluate whether your search engine optimization efforts are driving real business outcomes, leads, revenue, qualified traffic, and growth, not just numbers that look impressive in a slide deck.
Think of it this way. A fitness tracker does not just tell you that you moved today. It tells you how far you walked, how many calories you burned, and whether you are getting closer to your goal weight. SEO KPIs work the same way. They do not just say “your site got 50,000 visits.” They tell you which traffic, from which keywords, is converting at what rate, turning into how much revenue.
At HM Digital Solution, we manage SEO campaigns for businesses across Delhi, India, and beyond. And in our experience, the single biggest reason SEO fails to produce business results is not bad content or weak links. It is businesses tracking the wrong things and making decisions based on metrics that were never connected to growth in the first place.
This guide is designed to change that.
SEO KPIs vs SEO Metrics: What is the Difference? {#kpis-vs-metrics}
This distinction matters more than most people realize.
A metric is any measurable data point about your website. Total pageviews, domain authority score, number of indexed pages, and social shares are all metrics.
A KPI is a metric that is directly tied to a specific business goal. Not all metrics are KPIs, but all KPIs are metrics.
Here is a simple test for any number you are tracking: “If this number went up 50%, would we make more money or get meaningfully closer to our goal?”
If the honest answer is “not necessarily,” it is probably just a metric, not a KPI. If the answer is “yes, absolutely,” you have found a real KPI.
| Just a Metric | A Real SEO KPI |
|---|---|
| Total pageviews | Organic conversions from service pages |
| Number of indexed pages | Indexation rate of important pages |
| Domain Authority score | Referring domains growth (month over month) |
| Total impressions | Organic CTR for commercial keywords |
| Pages published per month | Organic revenue per content cluster |
The goal is not to track fewer things. The goal is to track the right things.
Why Tracking the Wrong SEO Metrics is Costing You Money
Here is a scenario we see constantly at HM Digital Solution.
A business runs SEO for 8 months. Every monthly report shows impressive numbers. Organic sessions up 60%. Domain authority climbing. 40 new keywords ranking on page one. The client is happy until they realize that leads have not moved at all. Revenue from organic search is flat. Six figures spent on SEO and the pipeline is empty.
What went wrong?
The team was tracking visibility metrics and reporting them as if they were outcome metrics. Sessions, rankings, and impressions were climbing. But nobody had tracked what happened after users landed. Nobody had measured whether the 40 new keywords were transactional or purely informational. Nobody had asked whether the people visiting the blog were even remotely interested in buying.
In 2026, this problem has gotten worse because of three major shifts in how search works:
1. AI Overviews are eating click share. Many queries that used to send traffic to your site now get answered directly in Google. You can rank position 1 and still see your CTR drop 40% because an AI-generated answer sits above you.
2. Zero-click searches are at an all-time high. Impressions and even rankings tell you less about actual traffic than they used to. A page can appear 100,000 times in search results and get 800 clicks.
3. Search intent has fragmented. The same keyword can mean completely different things to different users across different devices, locations, and contexts. Ranking for a keyword does not automatically mean you are reaching the right audience.
This is why your SEO KPI stack needs to go far deeper than traffic and rankings.
The 3-Tier SEO KPI Framework {#3-tier-framework}
Instead of randomly tracking 15 to 20 metrics every month, we recommend organizing your SEO KPIs into three tiers based on how directly they connect to actual business results.
| Tier | What It Answers | Key KPIs |
|---|---|---|
| Tier 1: Business Impact | Is SEO making us money? | Organic conversion rate, SEO ROI, revenue per visit |
| Tier 2: Visibility and Engagement | Are we reaching the right people? | Keyword rankings (by intent), CTR, AI visibility, engagement rate |
| Tier 3: Technical and Authority | Is our site capable of ranking? | Core Web Vitals, indexation rate, referring domains |
Most businesses spend 90% of their SEO conversations on Tier 2 and Tier 3 metrics, and almost no time on Tier 1. This is backwards.
Always start with Tier 1. If your SEO is not generating conversions and revenue, the right response is to ask why, and that investigation usually leads you into Tier 2 and Tier 3 for answers.
Tier 1: Business-Impact SEO KPIs {#tier-1}
KPI 1: Organic Conversion Rate
What it is: The percentage of organic search visitors who complete a meaningful action on your website, filling a contact form, booking a consultation, making a purchase, calling your business, or signing up for a service.
Why it matters more than traffic:
This is the most important SEO KPI for any business that actually wants SEO to contribute to revenue.
Let us be blunt. A blog post getting 20,000 monthly organic visits but generating 0 leads is not an SEO success story. A service page getting 600 monthly visits and generating 18 enquiries is. The difference is not traffic volume; it is whether the traffic is qualified and whether the page is designed to convert.
Organic conversion rate is the number that bridges your SEO work and your sales team. If this number is healthy, every improvement in organic traffic multiplies your revenue. If this number is broken, more traffic just means more unqualified visitors.
Real example from our work:
We managed SEO for a Delhi-based healthcare clinic. Their blog was getting 9,000 organic sessions per month, but the clinic was receiving just 6 appointment enquiries from organic search each month. After auditing which pages were getting traffic, we discovered almost all of it was going to a general health tips blog with no commercial intent.
We shifted the content strategy toward symptom-specific and treatment-specific pages, added clear appointment CTAs, and restructured the internal linking to push users from blog content toward service pages. Within 90 days, organic enquiries went from 6 to 41 per month, with no significant increase in overall traffic.
The traffic did not change much. The conversion rate did.
How to track it in GA4:
1. Go to Admin > Data Display > Events
2. Mark your important actions as Key Events (form_submit, generate_lead, purchase, phone_click, appointment_booking)
3. Go to Reports > Acquisition > Traffic Acquisition
4. Filter by Organic Search channel
5. Add Event Name as a secondary dimension to see which conversions are coming from organic
Benchmark:
| Page Type | Healthy Organic Conversion Rate |
|---|---|
| B2B Service / Consultation Pages | 2% to 5% |
| E-commerce Product Pages | 1% to 3% |
| Healthcare / Local Service Pages | 1.5% to 4% |
| Blog / Informational Content | 0.3% to 1% |
| Pricing or Comparison Pages | 5% to 10% |
Quick improvement tip: Go to GA4 > Reports > Engagement > Landing Page. Sort by organic sessions. Find your top 10 organic landing pages and check their conversion rates individually. Any page with high sessions but below-benchmark conversion rate is your priority to fix.
KPI 2: SEO ROI
What it is: The return on investment generated by your SEO work, measured by comparing the revenue your organic channel produces against what you spend on SEO.
Formula:
SEO ROI = (Revenue from Organic Search - Total SEO Cost) / Total SEO Cost x 100Example:
You spend Rs. 40,000 per month on SEO (agency fee + tools + content). Your organic channel generates Rs. 2,00,000 in tracked revenue that month. Your SEO ROI = 400%.
What to include in your SEO cost calculation:
→ Agency or freelancer fees
→ SEO tools (Ahrefs, SEMrush, SEOptimer, Screaming Frog, etc.)
→ Content writing, editing, and design costs
→ Developer or technical SEO hours
→ Link building outreach costs
→ Internal team time (approximate hourly cost)
Why this KPI changes everything:
Without SEO ROI, SEO is just a cost on your P&L. With it, SEO becomes a measurable growth investment that you can defend, scale, and optimize like any other business channel.
When we present SEO ROI data to clients, it also changes how they invest in SEO. A client who sees 350% ROI from their organic channel does not ask whether to continue the SEO retainer. They ask how to increase the budget to scale it.
How to track revenue from organic search:
For e-commerce: Enable Enhanced E-commerce in GA4 and connect your Shopify or WooCommerce store. Revenue attribution from organic sessions is tracked automatically.
For lead generation businesses: Assign a monetary value to each lead based on your average close rate and average deal size. If you close 20% of leads and your average deal is Rs. 50,000, each lead is worth Rs. 10,000. Multiply by your monthly organic leads.
For service businesses: Use your CRM to tag which closed clients originally came from organic search. Pull this data monthly.
KPI 3: Revenue Per Organic Visit
What it is: The average revenue generated per organic search session.
Formula:
Revenue Per Organic Visit = Total Organic Revenue / Total Organic SessionsWhy track this separately from total revenue:
This KPI catches a problem that raw revenue numbers hide. If your organic sessions grow 40% and your organic revenue grows only 15%, your revenue per visit has declined. That means your traffic quality has dropped, you are attracting more people but they are less likely to buy.
This often happens when content teams publish lots of high-volume informational content to boost traffic, without checking whether that new audience has any commercial intent.
Tracking revenue per organic visit gives you a quality signal alongside your volume signals.
Tier 2: Visibility and Engagement SEO KPIs {#tier-2}
KPI 4: Keyword Rankings (Segmented by Intent)
What it is: Where your pages appear in Google search results for specific target keywords.
Most SEO teams track keyword rankings. Very few track them correctly.
The mistake is treating all keyword rankings as equally valuable. A position 2 ranking for “what is digital marketing” has almost no revenue value for a digital marketing agency. A position 6 ranking for “SEO agency in Delhi” can generate lakhs in revenue each month.
How to segment your keyword rankings:
| Search Intent | Example Keyword | Business Value |
|---|---|---|
| Transactional | “SEO services in Delhi” | Very High |
| Commercial Investigation | “best SEO company India” | High |
| Local Intent | “SEO agency near Connaught Place” | High |
| Informational | “what are SEO KPIs” | Medium (top of funnel) |
| Navigational | “HM Digital Solution contact” | Brand / Retention |
Always prioritize improving rankings for transactional and commercial investigation keywords first. These are the keywords where users are actively evaluating whether to hire someone or buy something.
Real example:
A real estate client in Delhi had 35 keywords ranking on page 1. Impressive, right? But when we segmented by intent, 28 of those keywords were purely informational (“how to buy a flat in Delhi”, “property registration process India”). Only 7 were commercial keywords. Their leads were coming almost entirely from those 7 keywords. The other 28 were generating traffic with zero conversion potential.
We shifted the content calendar to target more commercial intent keywords. Six months later, transactional keyword rankings had grown from 7 to 23, and monthly leads had tripled.
How to track keyword rankings:
Use Google Search Console for free position data. For competitive tracking, intent segmentation, and local rankings, paid tools like Ahrefs, SEMrush, or SE Ranking give you much more granular data.
For tracking how your overall content strategy is performing by topic cluster, see our guide on Site Architecture for Topical Authority.
KPI 5: Organic Click-Through Rate (CTR)
What it is: The percentage of users who clicked your listing after seeing it in search results.
Formula:
CTR = (Organic Clicks / Organic Impressions) x 100Why this is one of the most underused SEO KPIs:
You can rank position 2 for a valuable keyword and still get less traffic than a competitor ranking position 4 if their title tag and meta description are significantly more compelling.
CTR is where SEO meets copywriting. A weak title tag wastes your entire ranking effort. And because Google uses click behaviour as a ranking signal, a consistently low CTR on a page can also gradually hurt your position over time.
2026 CTR Benchmarks by Position:
| SERP Position | Average Organic CTR (2026) |
|---|---|
| Position 1 | 13% to 17% |
| Position 2 | 7% to 11% |
| Position 3 | 5% to 8% |
| Position 4 to 5 | 3% to 5% |
| Position 6 to 10 | 1% to 3% |
| Position 11 to 20 | Under 1% |
Important note for 2026: These numbers are lower than they were in 2023, primarily because AI Overviews, featured snippets, and People Also Ask boxes now sit above organic results for many queries, consuming click share before users ever see your listing.
Real example:
An education client we work with had their admissions page ranking at position 3 for “MBA colleges in Delhi NCR” with a 3.1% CTR, well below the expected range for that position. Their title tag was: “MBA Admissions Institute Name.”
We rewrote it to: “MBA Admissions 2026 in Delhi NCR Apply Before July 31 Deadline.”
CTR jumped to 7.8% within three weeks. Same ranking. 2.5x more traffic. Zero additional SEO spend.
Quick win: In Google Search Console, go to Performance > Search Results. Sort by Impressions (high to low). Look for any page with over 1,000 impressions but below-benchmark CTR. Those are your highest-leverage opportunities. Rewrite the title tag and meta description and check back in 2 to 3 weeks.
KPI 6: Organic Impressions vs Clicks Gap
What it is: The ratio between how often your pages show up in search results and how often people actually click on them.
A page with 80,000 monthly impressions and 600 clicks has a 0.75% CTR. That gap of 79,400 non-clicks represents a massive amount of potential traffic being left on the table.
What causes a large Impressions vs Clicks gap:
→ Title tags that are generic or do not match search intent
→ Meta descriptions that are cut off or uninspiring
→ AI Overviews answering the query without needing a click
→ SERP features (Knowledge Panel, featured snippets) taking click share
→ Ranking for high-volume keywords that are purely informational with no click intent
Monitoring this gap month over month helps you identify whether your SEO problem is a visibility issue (not enough impressions) or a messaging issue (impressions are high but nobody is clicking).
How to track: Google Search Console > Performance > Search Results. Toggle both Total Impressions and Total Clicks on. Look at your pages with the largest impression numbers and check whether clicks are proportional.
KPI 7: Engagement Rate and Dwell Time
What it is: In GA4, the Engagement Rate is the percentage of sessions where users did something meaningful, stayed for more than 10 seconds, viewed multiple pages, or completed a conversion event. Dwell time refers to how long users spend on your site after clicking through from search.
Why it matters:
If users are landing on your pages from Google and immediately hitting the back button, two things happen. First, you are obviously not serving them well, which means your content needs work. Second, Google tracks this behavior and it can negatively influence your rankings over time.
High engagement rate signals that your content is genuinely useful and relevant to the search query. It is one of the clearest indirect ranking factors.
Benchmark: Aim for an engagement rate above 55% for blog content, and above 65% for service or product pages.
How to improve engagement rate:
→ Make sure the content actually matches the search intent of the keywords bringing users in
→ Improve page load speed (directly affects whether users wait or bounce)
→ Add internal links to keep users on the site longer
→ Break up long content with tables, visuals, and subheadings so it is easier to read
→ Put the most important information near the top of the page
KPI 8: AI Overview and LLM Visibility
What it is: Whether your brand, website, or content is being cited, mentioned, or recommended in AI-generated answers in Google AI Overviews, ChatGPT, Perplexity, Gemini, and other large language model tools.
Why this is the most important new SEO KPI for 2026:
This is a significant shift in how discovery works. Millions of users in India and globally now get answers directly from AI systems without clicking any website link. If your brand is being mentioned in those AI answers, you have reach and influence before the user ever visits your site. If you are invisible in AI-generated answers, you are missing a growing part of the search journey entirely.
Being cited in a Google AI Overview is increasingly functioning like a featured snippet used to in 2020 and 2021. It signals topical authority, drives brand awareness, and for users who want to go deeper, it does drive clicks.
What helps you appear in AI Overviews:
→ Clear, well-structured content that directly and concisely answers specific questions
→ Strong EEAT signals (Expertise, Experience, Authoritativeness, Trustworthiness)
→ Schema markup that helps Google understand your content structure
→ Topical depth covering a subject comprehensively across multiple related pages
→ Being cited or referenced by other authoritative sources in your industry
How to track AI visibility:
→ Google Search Console is beginning to attribute some AI Overview traffic separately check regularly
→ Manually search your target queries in Google and observe whether your site appears in AI-generated answers
→ Use tools like SE Ranking, BrightEdge, or Semrush’s AI Overview tracker for automated monitoring
→ Monitor brand mentions using tools like Brand24 or Mention to catch LLM citations across platforms
For a complete optimization guide, see our in-depth post on Content Optimization for Google AI Overviews and our technical breakdown of How LLMs Interpret Search Intent.
Tier 3: Technical and Authority SEO KPIs {#tier-3}
KPI 9: Core Web Vitals
What it is: Google’s page experience metrics that measure real-world loading performance, interactivity, and visual stability for users visiting your site.
| Metric | What It Measures | Good Threshold | Needs Improvement | Poor |
|---|---|---|---|---|
| LCP (Largest Contentful Paint) | Load speed | Under 2.5s | 2.5s to 4s | Over 4s |
| INP (Interaction to Next Paint) | Responsiveness | Under 200ms | 200ms to 500ms | Over 500ms |
| CLS (Cumulative Layout Shift) | Visual stability | Under 0.1 | 0.1 to 0.25 | Over 0.25 |
Why Core Web Vitals are a business KPI, not just a technical metric:
Poor Core Web Vitals affect both your rankings and your conversion rate. Google uses these scores as a ranking signal. But beyond rankings, slow pages with unstable layouts directly cost you conversions.
Multiple studies show that a 1-second delay in page load time reduces conversions by approximately 7%. On mobile, the impact is even greater. For an e-commerce site generating Rs. 5,00,000 per month in organic revenue, a 2-second load time improvement could realistically add Rs. 35,000 to Rs. 50,000 in additional monthly revenue without any new traffic.
Real example from our work:
A finance client’s key landing page had an LCP of 6.2 seconds on mobile. Organic traffic to the page was healthy, but the conversion rate was 0.6%, well below industry average. After our technical team optimized image compression, removed render-blocking scripts, and moved to a faster hosting environment, LCP dropped to 2.1 seconds. Conversion rate on the same page climbed to 2.4% within 45 days.
Same traffic. Four times more conversions. Just from fixing page speed.
How to check your Core Web Vitals:
- Google Search Console > Core Web Vitals report (shows field data from real users)
- PageSpeed Insights for both lab and field data
- Chrome DevTools Lighthouse for detailed developer diagnostics
For a deep dive into fixing Core Web Vitals issues, our Technical SEO guide covers every optimization in detail.
KPI 10: Crawl Coverage and Indexation Rate
What it is: The percentage of your important pages that Google has successfully crawled and indexed meaning they are eligible to appear in search results.
Formula:
Indexation Rate = (Indexed Pages / Total Submitted Pages in Sitemap) x 100Why this KPI is critical and often ignored:
A page that is not indexed does not exist in Google’s eyes. It cannot rank. It cannot generate traffic. It cannot convert. You can write a perfect piece of content with flawless on-page SEO, and if it has an accidental noindex tag or is blocked in your robots.txt, Google will never show it to anyone.
This is especially important for larger websites with 200+ pages, e-commerce sites with product and category pages, or any site that has gone through a redesign or CMS migration recently.
What causes indexation problems:
→ Accidental noindex tags left on pages after development or testing
→ Robots.txt blocking important pages or entire sections of the site
→ Pages with thin or duplicate content that Google chooses not to index
→ Crawl budget issues on very large sites where Googlebot prioritizes other pages
→ Canonical tag errors pointing pages to the wrong canonical URL
→ Slow crawl speed caused by server performance issues
How to track indexation rate:
Google Search Console > Pages report. This shows exactly which pages are indexed, which are not, and the specific reasons for any indexation failures.
For technical guidance on fixing indexation issues, see our detailed guides on Crawl Budget Optimization and Advanced Indexation Control in SEO.
KPI 11: Referring Domains and Backlink Quality
What it is: The number of unique, authoritative websites that link to your domain, and the overall quality and relevance profile of those links.
Why referring domains matter more than total backlink count:
This distinction trips up a lot of SEO teams. Total backlinks count every individual link. Referring domains count the unique websites those links come from.
50 backlinks from 50 different high-quality, relevant websites signals significantly more authority to Google than 500 backlinks from the same 3 websites. Diversity of referring domains is one of the clearest signals of genuine authority.
What to track in your backlink KPIs:
→ Total referring domains (and month-over-month growth trend)
→ Domain Rating or Domain Authority of linking sites (filter for quality)
→ Dofollow vs Nofollow ratio
→ Anchor text distribution (watch for over-optimization)
→ New backlinks gained and lost each month
→ Competitor referring domain gap which sites link to your competitors but not to you?
Real example:
An automobile dealership client in Delhi had 1,200 total backlinks, which sounded healthy. But when we analyzed referring domains, they only had 38 unique referring domains, meaning almost all those links came from a small set of low-quality directory sites. Their organic authority was severely underestimated by Google. After a 6-month link-building campaign focused on automotive blogs, local business directories, and industry publications, their referring domains grew to 94. Organic traffic from competitive transactional keywords grew 67% over the same period.
How to track:
Google Search Console > Links report shows your top linking sites for free. For deeper analysis including competitor comparison, anchor text breakdown, and link quality scoring, Ahrefs, Moz, or SEMrush provide the most comprehensive data available.
For strategy guidance on building quality links, see our posts on Topical Authority vs Domain Authority and Building Knowledge Graph Signals for Local Businesses.
SEO KPI Benchmarks Table 2026 {#benchmarks}
Use this as your quick reference for evaluating current performance and setting targets.
| SEO KPI | Needs Work | Average | Strong |
|---|---|---|---|
| Organic Conversion Rate (B2B Service) | Under 1% | 1% to 3% | 3%+ |
| Organic Conversion Rate (E-commerce) | Under 0.5% | 0.5% to 2% | 2%+ |
| SEO ROI | Under 100% | 100% to 300% | 300%+ |
| Organic CTR (Position 1 to 3) | Under 5% | 5% to 12% | 12%+ |
| Engagement Rate (Blog Content) | Under 40% | 40% to 60% | 60%+ |
| LCP (Core Web Vitals) | Over 4s | 2.5s to 4s | Under 2.5s |
| Indexation Rate | Under 70% | 70% to 90% | 90%+ |
| Referring Domain Growth (Monthly) | 0 to 2 new | 3 to 8 new | 8+ new |
| Month-over-Month Organic Traffic Growth | Under 2% | 2% to 8% | 8%+ |
| Branded vs Non-Branded Traffic Split | Over 70% branded | 40% to 70% branded | Under 40% branded |
How to Set Up SEO KPI Tracking From Scratch {#setup}
If you are starting fresh or auditing your existing tracking setup, follow these five steps.
Step 1: Connect your core tools
You need at minimum: Google Analytics 4, Google Search Console, and one rank tracking tool. These three alone give you visibility into most of the KPIs in this guide, and two of them (GA4 and GSC) are completely free.
Step 2: Configure Key Events in GA4
In GA4, go to Admin > Data Display > Events. Mark these actions as Key Events based on your business model:
→form_submit or generate_lead for service and B2B businesses
→purchase for e-commerce
→phone_click for local and service businesses
→appointment_booking for healthcare and professional services
→scroll_depth combined with session_duration for content engagement
Without properly configured Key Events, GA4 cannot tell you which organic visits are actually converting.
Step 3: Link Google Search Console with GA4
Go to GA4 Admin > Property Settings > Search Console Links. Connect your GSC property. This links your search visibility data (impressions, clicks, CTR, keyword positions) with your on-site behavior data (conversions, engagement). You get a complete picture of the full journey from search to action.
Step 4: Build your KPI dashboard in Looker Studio
Create a simple monthly dashboard in Google Looker Studio (formerly Data Studio) that pulls from both GA4 and GSC. Include:
→ Organic sessions and engaged sessions trend (month over month and year over year)
→ Organic conversion rate by landing page
→ Top keywords by clicks and CTR
→ Core Web Vitals status summary
→ New and lost backlinks (from your rank tracking tool)
Step 5: Record a baseline and set monthly review cadence
Before you start any optimization work, record your current performance across all KPIs you plan to track. This becomes your baseline. Set a fixed monthly review date and compare against the previous month AND the same month from the previous year to properly account for seasonality.
Common SEO KPI Mistakes That Sabotage Growth {#mistakes}
After managing SEO across hundreds of campaigns for businesses in Delhi, Noida, Gurgaon, and across India, these are the mistakes we see most often.
Mistake 1: Celebrating traffic growth without checking conversion rate
Traffic is the starting point, not the destination. Before you put a traffic increase in your monthly report as a win, check whether conversions moved proportionally. Traffic up 30%, conversions up 2%, that is not a win. That is a traffic quality problem that needs investigation.
Mistake 2: Not splitting branded and non-branded traffic
A sudden organic traffic spike often has nothing to do with SEO work. It could be a PR mention, a viral social media post, or a seasonal branded search increase. If you do not separate branded from non-branded organic traffic, you cannot tell the difference between a genuine SEO win and external noise.
Mistake 3: Tracking keyword rankings without filtering by intent
Ranking for 100 informational keywords while your 5 transactional keywords are stuck on page 2 is a very bad strategic position. Always track and prioritize rankings by intent category. Commercial and transactional rankings should get the most attention.
Mistake 4: Ignoring AI Overview impact on CTR
In 2026, many position 1 rankings now sit below an AI Overview. Your CTR for that keyword may have dropped 35% to 50% even as you have maintained your ranking position. If you only track rankings, you will completely miss this shift. Always monitor CTR alongside rankings.
Mistake 5: Sending stakeholders a report with 20 metrics and no context
A report with 20 numbers and no explanation is not useful, it creates confusion and erodes trust in SEO as a channel. Focus on 6 to 8 KPIs maximum in any stakeholder report. Explain what each number means in plain language and what action it should drive.
Mistake 6: Not tracking SEO ROI because “it is complicated”
We understand that revenue attribution is not always clean, especially for B2B businesses with long sales cycles. But not tracking it at all leaves SEO permanently in a “we cannot really measure this” category, which makes it the first budget to cut when finances tighten. Even a rough estimate of SEO-attributed revenue is significantly better than no estimate.
Monthly SEO KPI Reporting: What to Include {#reporting}
A good SEO report does three things: tells you what happened, explains why it happened, and tells you what to do next.
Here is the structure we use at HM Digital Solution for monthly client reports.
1. Executive Summary (1 short paragraph) What are the 2 to 3 biggest wins this month? What are the 1 to 2 biggest challenges or concerns? What is the overall direction of the campaign?
2. Business Impact KPIs (Tier 1)
→ Organic conversions (total and by type: forms, calls, purchases)
→ Organic revenue or estimated revenue value
→ SEO ROI vs previous period
3. Visibility and Engagement KPIs (Tier 2)
→ Organic sessions and engaged sessions (with month-over-month and year-over-year comparison)
→ Top keyword rankings with movement highlights
→ Organic CTR for priority pages
→ AI Overview mentions (new for 2026)
4. Technical Health Summary (Tier 3)
→ Core Web Vitals status (are any pages in the Poor zone?)
→ Index coverage (any new errors or deindexed pages?)
→ New backlinks acquired and referring domains gained or lost
5. Next Month Action Plan Every report should end with: “Based on this month’s data, here are the 3 specific things we recommend focusing on next month, and here is exactly why each one will move the needle.”
This last section is what separates an actionable SEO report from a data dump.
Frequently Asked Questions {#faqs}
Q.1 What is the difference between an SEO metric and an SEO KPI?
A metric is any measurable data point about your website’s performance. A KPI is a metric that is directly connected to a specific business goal. Pageviews are a metric. Organic conversions from service pages are a KPI. The distinction matters because tracking metrics without business context leads to reports that look good but do not inform strategy.
Q.2 How many SEO KPIs should I track?
Between 6 and 10 for most businesses. Fewer than 5 and you have blind spots. More than 10 and you end up with analysis paralysis, spending more time building reports than making decisions. Start with 3 Tier 1 KPIs (conversions, ROI, revenue per visit) and add the most relevant Tier 2 and Tier 3 KPIs based on your business model.
Q.3 How long before SEO KPIs start showing movement?
Technical SEO improvements (Core Web Vitals, indexation fixes) can show ranking impact within 4 to 6 weeks. Conversion rate and engagement improvements from on-page work typically show within 4 to 8 weeks. Keyword ranking improvements for competitive terms generally take 3 to 6 months. Backlink-driven authority improvements are typically visible over a 4 to 9 month timeline.
Q.4 Should local businesses track different SEO KPIs?
Yes. For local businesses, KPIs like local pack rankings, Google Business Profile impressions and clicks, and local organic conversion rate become particularly important. For a Delhi-based service business, ranking in the local 3-pack for “SEO agency Delhi” is worth far more than ranking position 4 in regular organic results. See our dedicated guide on Local SEO for Small Businesses for a local-specific KPI framework.
Q.5 How do AI search tools affect traditional SEO KPIs?
AI Overviews and LLMs are reducing organic CTR for many informational queries and making impression-based metrics less reliable as proxies for traffic. The trend is toward tracking brand visibility in AI answers, revenue quality from the clicks that do come through, and topical authority signals that influence both traditional rankings and AI citations. Read our guide on Content Optimization for Google AI Overviews for specific tactics.
Q.6 What is a good SEO ROI for a small business in India?
For most small to mid-sized businesses in India, an SEO ROI above 200% after the first 6 months of a mature campaign is a reasonable target. New campaigns in the first 3 to 6 months may show negative ROI as rankings and traffic build. Over a 12-month horizon, well-executed SEO for Indian SMBs frequently delivers ROI in the 300% to 600% range, which is significantly higher than most paid advertising channels at equivalent traffic volumes.
Q.6 What tools do I need to track all these SEO KPIs?
At a minimum: Google Analytics 4 (free), Google Search Console (free), and one rank tracking tool (Ahrefs, SEMrush, or SE Ranking paid). For backlink analysis, PageSpeed Insights for Core Web Vitals (free), and Looker Studio for dashboards (free). If budget allows, adding a dedicated backlink monitoring tool and an AI visibility tracker rounds out a comprehensive SEO KPI stack.
Conclusion
Data is only valuable if it changes how you make decisions.
Most businesses are not failing at SEO because they do not have enough data. They are failing because they are tracking the wrong data, which leads to the wrong decisions, which leads to SEO budgets that feel like sunk costs rather than growth investments.
The framework in this guide gives you a structured way to approach SEO measurement:
Start with Tier 1. Get your business-impact KPIs right first. Organic conversion rate, SEO ROI, and revenue per organic visit should be in every SEO report, every month, without exception.
Then optimize Tier 2. Use your visibility and engagement KPIs to understand who is finding you, whether they are clicking, and whether they are engaging with your content once they arrive.
Then maintain Tier 3. Keep your technical foundation strong. Core Web Vitals, indexation health, and a growing referring domain profile are the infrastructure that makes everything else possible.
If you want a team that tracks these KPIs properly, connects SEO performance to revenue, and makes data-driven decisions every month on your behalf, HM Digital Solution works with businesses across India to build SEO systems that generate measurable, attributable growth.
Tanishka Vats
Lead Content Writer | HM Digital Solutions Results-driven content writer with over five years of experience and a background in Economics (Hons), with expertise in using data-driven storytelling and strategic brand positioning. I have experience managing live projects across Finance, B2B SaaS, Technology, and Healthcare, with content ranging from SEO-driven blogs and website copy to case studies, whitepapers, and corporate communications. Proficient in using SEO tools like Ahrefs and SEMrush, and content management systems like WordPress and Webflow. Experienced content writer with a proven track record of creating audience-centric content that drives significant results on website traffic, engagement rates, and lead conversions. Highly adaptable and effective communicator with the ability to work under deadlines.